pre-requisites
To use the functions in this tutorial in your own R session you would
need to use library to load the tidyverse
package as shown below. I’ve pre-loaded it for this tutorial.
library(tidyverse)Introduction to Gather and Spread
Wide data
There are two main ways that spreadsheets can be organized. The wide data format has one individual or sample per row and observations spread across multiple columns.
Wide Data Example 1There is one fruit type per row and multiple observations types across the columns.
There is one tomato plant per row and multiple observations of different phenotypes in the columns:
Long data
Alternatively, in the long data format there is a single observation per row, and a key that indicates the type of observation.
Long Data Example 1Who cares?
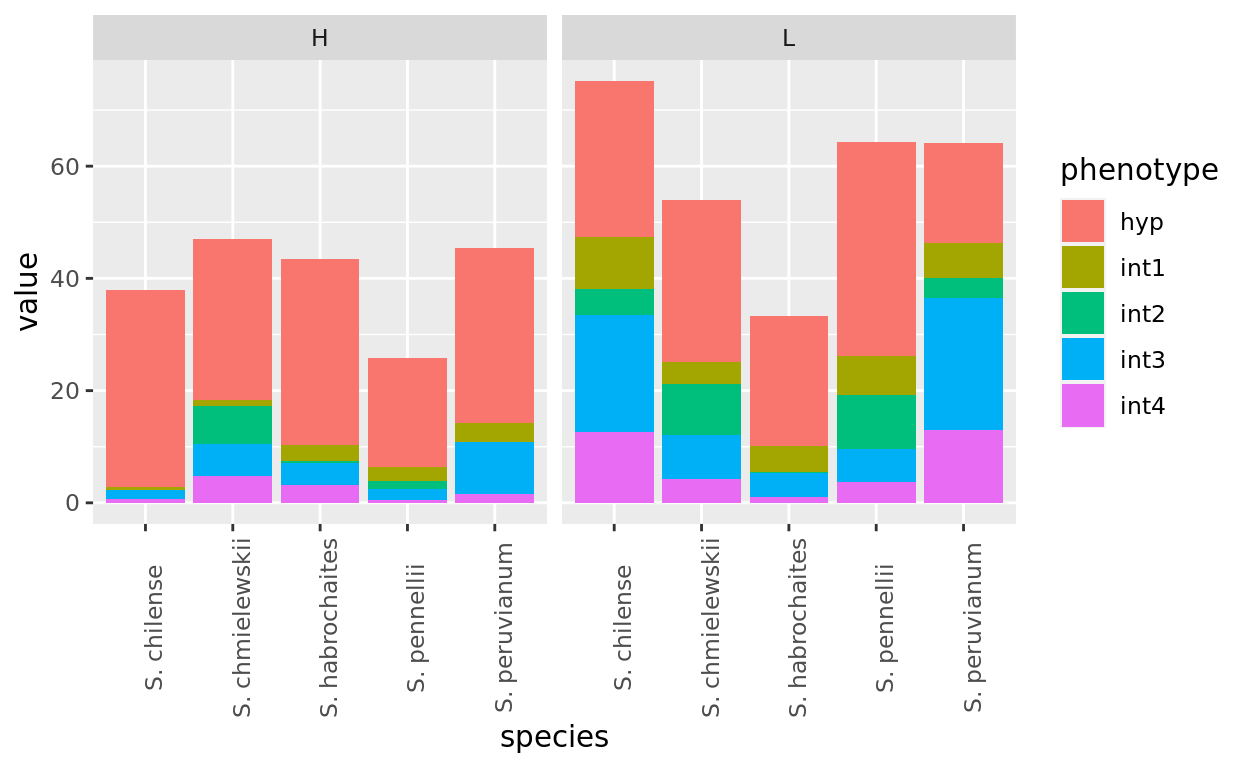
Typically data arrives in the wide format. Often to accomplish the analyses you will want to do in R you will need it in the long format. For example, ggplot only deals with a single column of values per aesthetic. If you want to plot multiple categories of observations at once you need them gathered into the long format. For example to make the graph below, the data has to be in the long format:
Gathering
To convert wide format to long format we use the
gather() function from tidyverse. It is appropriately
named, because we are gathering columns of data.
Intro to gather
Let’s look again at the original fruit data set:fruit.long <- fruit %>%
gather(key="data_type", # the column name of the new column that will contain the key
value="value", # the column name of the column that will contain the observations
color, shape, size # the column names that we want to gather.
)
fruit.longPay attention to the arguments.
keydefines the column name of the new column that will contain the keyvaluedefines the column name of the column that will contain the actual data- The remaining arguments specify the columns that are to be gathered.
Column specification
There are multiple ways that you can specify the columns to be gathered.
*You can list them all, as done in the first example:
fruit.long <- fruit %>%
  gather(key="data_type", # the column name of the new column that will contain the key
         value="value", # the column name of the column that will contain the observations
         color, shape, size # the column names that we want to gather.
  )
fruit.long*You can specify them as a range from the first to last column that you want:
fruit.long <- fruit %>%
  gather(key="data_type", # the column name of the new column that will contain the key
         value="value", # the column name of the column that will contain the observations
         color:size # the column names that we want to gather.
  )
fruit.long
*You can instead use the - to indicate columns that you
do not want to gather; all others will be included. Try it by changing
the code below
fruit.long <- fruit %>%
  gather(key="data_type", # the column name of the new column that will contain the key
         value="value", # the column name of the column that will contain the observations
         -COLUMN_NAME_TO_EXCLUDE
  )
fruit.long
Gather the tomato data
Practice what you learned above to gather the hyp, int1, int2, int3, and int4 columns together in the tomato data set. Your end product should look like this:
Spread your data
What if you need to go the other direction, from long format to wide?
For this we use the spread() function, to spread our values
across multiple columns.
If we start with a long data set:
fruit.long %>%
  spread(key = "data_type", # which column holds the key?
         value = "value") # which column contains the values?
Now try spreading the the tomato data to recreate the original format. Modify the code below.
I have created a tomato.long data set. First take a
look:
tomato.longtomato.long %>%
spread(...)More information
More information on these functions is provided in chapter 12 of R for Data science